PERF & FLAME GRAPH INSTRuCTIONS
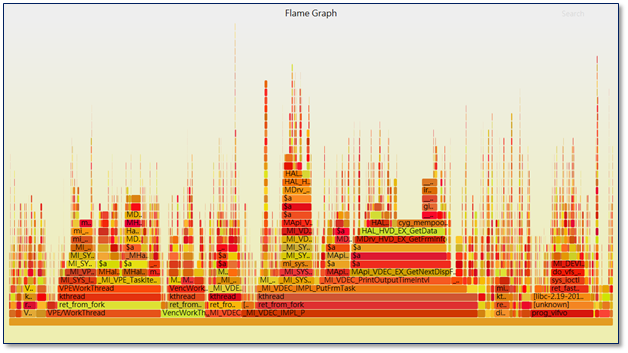
Flame Graph provides visual performance analysis, presented in SVG format, supports zooming, and can quickly locate CPU performance bottlenecks. Flame Graph统计了采样周期内,code-path被执行的时间比例,纵轴是code-path,从下至上一般就是call stack。横轴是某个stack的占用时间,跨度越大说明其占CPU比重越高,也就是最耗费CPU的,stack在横轴上是按照字母序排列的,颜色深浅仅仅是为了区分,并没特殊意义。
The following is the Flame Graph generation process:
-
Use perf to get system execution status
-
Step 1:Execute perf record on EVB
# ./perf record -a -g sleep 10

-a : CPU

-o : Specify the output file, if not, it will be automatically saved in the current directory, named perf.data

-g : Record call stack

sleep : Specify the duration. Unit: second
If it displays during execution, it means that the system lacks GCC runtime library, please put libgcc_s.so.1 under /mnt or other path, and add it to LD_LIBRARY_PATH.
# export LD_LIBRARY_PATH=/mnt:/lib -
Step 2:Execute perf report to analyze the saved data
# ./perf reportDisplay the call stack and running time ratio of each leaf function directly on the console.
If FlameGraph analysis is performed directly, perf report is not necessary.
-
-
Use data to generate flame graphs
-
Step 1:Execute
perf scripton EVB to parse the data and archive the output result to p1# ./perf script -i perf.data > p1 -
Step 2:Switch to PC, click to get FlameGraph, execute
stackcollapse-perfprovided by FlameGraph on PC to fold the symbols of p1 and save it to disk# stackcollapse-perf.pl p1 &> perf.folder -
Step 3:Execute p1 provided by FlameGraph on the PC to convert
perf.foldertosvg, which can be opened with a browser (Chrome or Firefox is recommended)# flamegraph.pl perf.folder > perf.svgGenerate Flame Graph command:
./perf record -a -g -F 2599 -p 451 sleep 30
./perf script -i perf.data > p1
./stackcollapse-perf.pl p1 &> perf.folder
./flamegraph.pl perf.folder > perf.svg
-
Reference: